

OpenTelemetry in LLMOps: Observability for AI Systems
To understand OpenTelemetry and what LLMOps, we first need to know what observability? Why we need it for AI systems? Once we understand observability, we can move to LLMOps, how it works, and how OpenTelemetry helps us use it better.
What is observability?
As a DevOps or MLOps engineer, or an AI developer working on LLMs, we know that AI systems and large language models can be very complex and while developing AI applications or building LLM based programs, we may face issues in the code, the model, or the system that cause failures. We cannot always figure out what went wrong just by looking at the output or revisiting all the lines of code. That’s why teams like yours need better visibility and understanding of these complex systems. You need simple ways to watch, track, and show issues across the AI pipeline to keep everything running smoothly.
This is where observability comes in. Observability is checking what is going on inside the system by using data like logs, metrics, and traces. It helps us know how our system is working and where it is failing. Instead of guessing the problem, we can see the data and find the exact issue. In simple words, observability helps us understand our system better and fix issues faster.
What is LLMOps?
On high level LLMOps is set of stages from the development of LLM based applications to deployment & maintaining it.
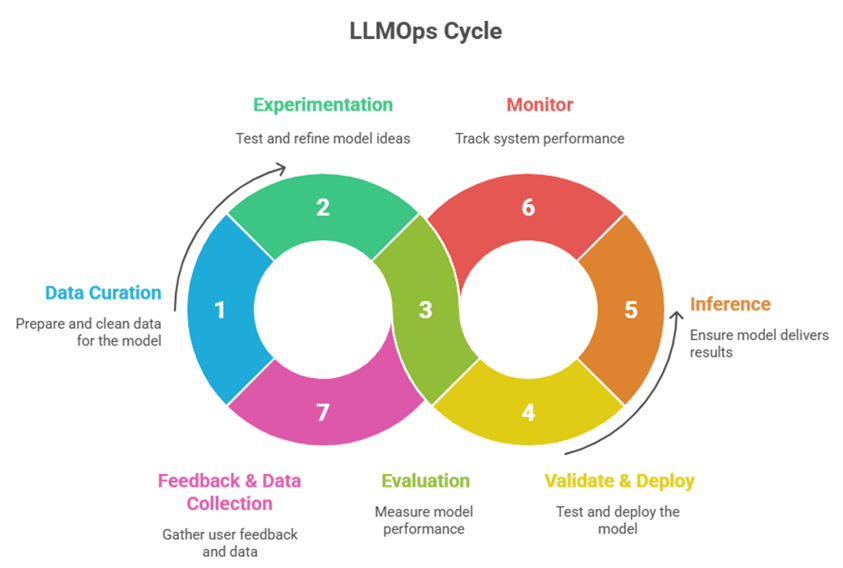
We can think of LLMOps as a workflow cycle that ensures LLM-based solutions are built, tested, deployed, and improved efficiently.
The main stages in the LLMOps cycle include:
• Data Curation: Preparing processing of data and cleaning data.
• Experimentation: Trying different ideas, prompts, and model settings.
• Evaluation: Checking and comparing the results.
• Validate & Deploy: Safely testing and moving the best model to production.
• Inference: Running the model to provide real-time responses.
• Monitor: Keeping an eye on performance, quality, and stability.
• Feedback & Data Collection: Learning from user feedback and improving continuously.
What is OpenTelemetry (OTel)?
OpenTelemetry (OTel) is an open-source observability framework designed to collect, process, and export telemetry data such as logs, metrics, and traces from applications and services.
It helps developers understand how their systems behave in real-time, especially in distributed or cloud environments.
Think of it as the “nervous system” of your software, it tells you what’s happening inside your application at every step.
Key Components of OpenTelemetry
|
Component |
Purpose |
|
Traces |
Record the journey of a single request as it passes through different components or services. |
|
Metrics |
Provide numerical data about performance — like latency, token count, or request throughput. |
|
Logs |
Capture detailed event or error information for debugging. |
|
Exporters |
Send telemetry data to monitoring tools (Azure Monitor, Grafana, Jaeger, Datadog, etc.). |
What OpenTelemetry is NOT
- OpenTelemetry isn’t a monitoring or analytics platform, it’s a framework for collecting and exporting telemetry data.
- Not a full monitoring tool: It doesn’t replace Datadog, Prometheus, or Azure Monitor, it just feeds them data.
- Not for storage or dashboards: OTel doesn’t store or visualize data; tools like Grafana or Jaeger do that.
- Not plug-and-play: It needs setup and integration; no built-in alerts or dashboards.
- Not a performance optimizer: It surfaces insights but doesn’t automatically improve performance.
In short, OpenTelemetry provides the data, other tools make sense of it.
What is Instrumentation?
Instrumentation is the process of adding code or tooling to an application, so it can automatically generate telemetry data such as traces, logs, and metrics about what the application is doing.
Types of Instrumentation
• Automatic Instrumentation
Adds telemetry without modifying your code (via plugins/agents).
• Library Instrumentation
Pre-built OTel integrations for frameworks (FastAPI, Flask, Django, SQLAlchemy, etc.).
• Manual Instrumentation
Adding OTel spans, metrics, and logs directly in your code for full control.
Now, let’s see how to use OpenTelemetry instrumentation to collect logs, traces, and metrics.
Before we start instrumenting our Python AI code with OpenTelemetry, we need a few Azure monitoring resources. These resources will receive, store, and visualize the telemetry data generated by our application.
To get started, make sure you have:
- Azure Monitor: the central observability platform
- Application Insights: stores and visualizes traces, logs, and metrics
- Log Analytics Workspace: used for querying and linking data
- Python environment: where we install and configure OpenTelemetry
Once you have the resources, we can start the instrumentation in code.
Install the required packages:
pip install azure-monitor-opentelemetry opentelemetry |
Minimal instrumentation setup to collect logs, traces, and metrics and send them to Azure Application Insights:
|
|
Don’t forget the connection string
Add this to your .env or environment variables:
APPLICATIONINSIGHTS_CONNECTION_STRING=InstrumentationKey=;IngestionEndpoint=https://.in.ai.monitor.azure.com/ |
This connects your code to Azure Application Insights.
configure_azure_monitor() # Reads the key from environment |


